15. Structural Static Analysis
15.1 Construction Stage Analysis
See 9.8 Construction Stages, 10.2 Construction Stage Settings.
15.2 Operation Stage Analysis
See 10.3 Operation Stage Settings.
15.3 Settlement Case Analysis
The steps for Qiaotong software to perform support settlement analysis are as follows:
-
Define support load settlement groups (supports that settle simultaneously) and settlement amount of each support in "Loads > Support Settlement > Support Settlement Groups";
-
Define load cases to which each support settlement group belongs in "Loads > Support Settlement > Support Settlement Load Cases";
-
"Loads > Support Settlement > Concurrent Reaction Groups" can define support node numbers for which complete concurrent reaction forces need to be output for settlement analysis;
-
Click "Analysis > Run Analysis" or shortcut key to perform structural analysis;
-
After successful analysis, view extreme value results of each case through "Results > Graphics" or "Results > Tables", or view complete concurrent support reaction force results of each case through "Results > Tables > Concurrent Reactions", or view self-concurrent beam element internal force results of each case through "Results > Tables > Internal Forces > Beam Element Self-Concurrent Internal Forces".
-
See 9.9 Support Settlement.
15.4 Moving Load Case Analysis
Qiaotong software can analyze the most unfavorable node displacements, element internal forces and stresses, support reactions, elastic link forces, and constraint equation forces of structures under the action of moving loads such as trains, vehicles, light rails, crowds, transverse live loads, etc.
-
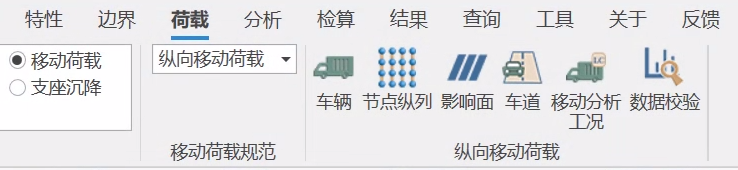
Before longitudinal moving load analysis, necessary steps such as establishing overall structural model and moving load analysis settings should be completed. The main operation process is:
1) Define vehicle loads in "Loads > Longitudinal Moving Loads > Vehicles"
2) Define node longitudinal arrays in "Loads > Longitudinal Moving Loads > Node Longitudinal Arrays"
3) Define influence surfaces in "Loads > Longitudinal Moving Loads > Influence Surfaces"
4) Define standard lanes or optimized lanes in "Loads > Longitudinal Moving Loads > Standard Lane Definitions"
5) Define moving analysis cases in "Loads > Longitudinal Moving Loads > Moving Analysis Cases"
6) Set moving load analysis options in "Analysis > Longitudinal Moving Loads"
7) Perform moving load data verification in "Loads > Longitudinal Moving Loads > Data Verification"
8) Click "Analysis > Run Analysis" or shortcut key

Perform structural analysis;
9) After successful analysis, view extreme value result graphics or tables of each case through "Results > Graphics" or "Results > Tables". In "Beam Element Internal Force Result Table" and "Support Reaction Result Table", right-click and select "Show Maximum Values" to view
10) View self-concurrent results of beam element internal forces and support reactions (results of same element/support occurring simultaneously).
-
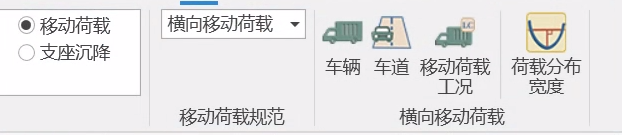
Before transverse moving load analysis, necessary steps such as establishing transverse model and construction calculation should be completed. The main operation process is:
1) Define vehicle loads in "Loads > Transverse Moving Loads > Vehicles"
2) Define lanes in "Loads > Moving Loads > Lanes"
3) Define moving load cases in "Loads > Moving Loads > Moving Analysis Cases"
4) Set moving load analysis options in "Analysis > Moving Loads"
5) Click "Analysis > Run Analysis" to perform structural analysis
6) After successful analysis, view extreme value result graphics or tables of each case through "Results > Graphics" or "Results > Tables". In "Beam Element Internal Force Result Table" and "Support Reaction Result Table", right-click and select "Show Maximum Values" to view self-concurrent results of beam element internal forces and support reactions (results of same element/support occurring simultaneously).
🧐Note: For moving load content, see 9.5 Moving Loads.
15.4.1 Moving Load Specifications
Before defining moving loads, first select corresponding specification from moving load analysis data > moving load specifications. For longitudinal moving loads, the program currently provides Chinese bridge general specifications. For transverse moving loads, the software provides transverse moving loads not restricted by specifications, mainly used to analyze local effects when vehicle loads are loaded at different transverse positions of bridge structures.
When selecting different specifications, all functions related to moving loads will automatically change correspondingly, and previous specification-related function settings will be deleted. If switching causes set functions to be deleted by mistake, please use undo function to revert.
15.4.2 Load Distribution Width Tool
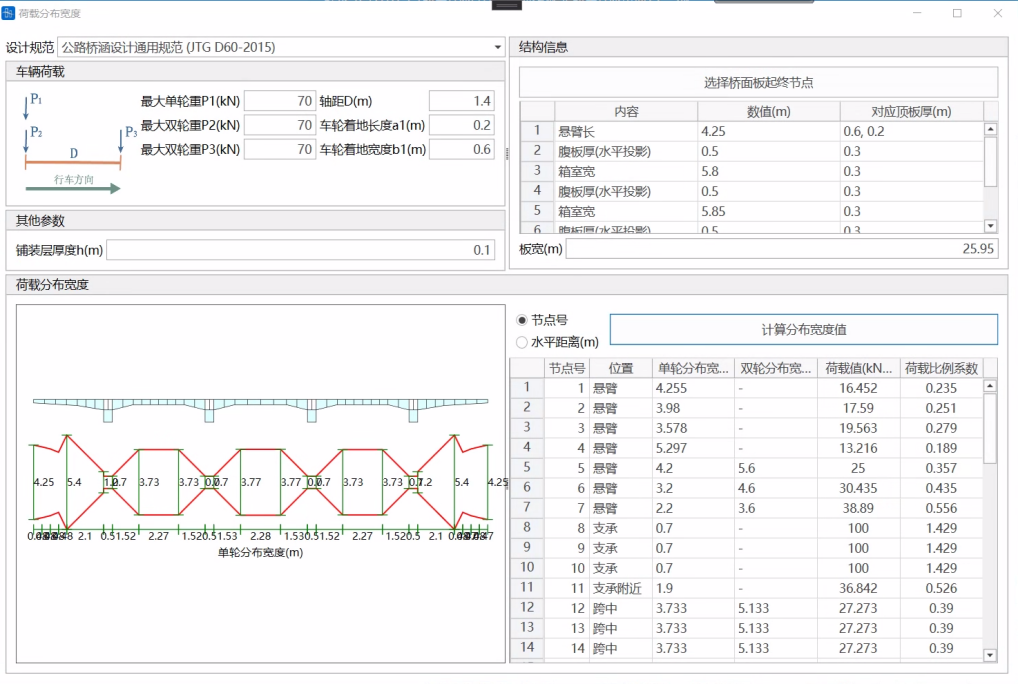
This tool is used to calculate one-way plate load distribution width. Users need to first establish transverse calculation model.
-
Design Specifications
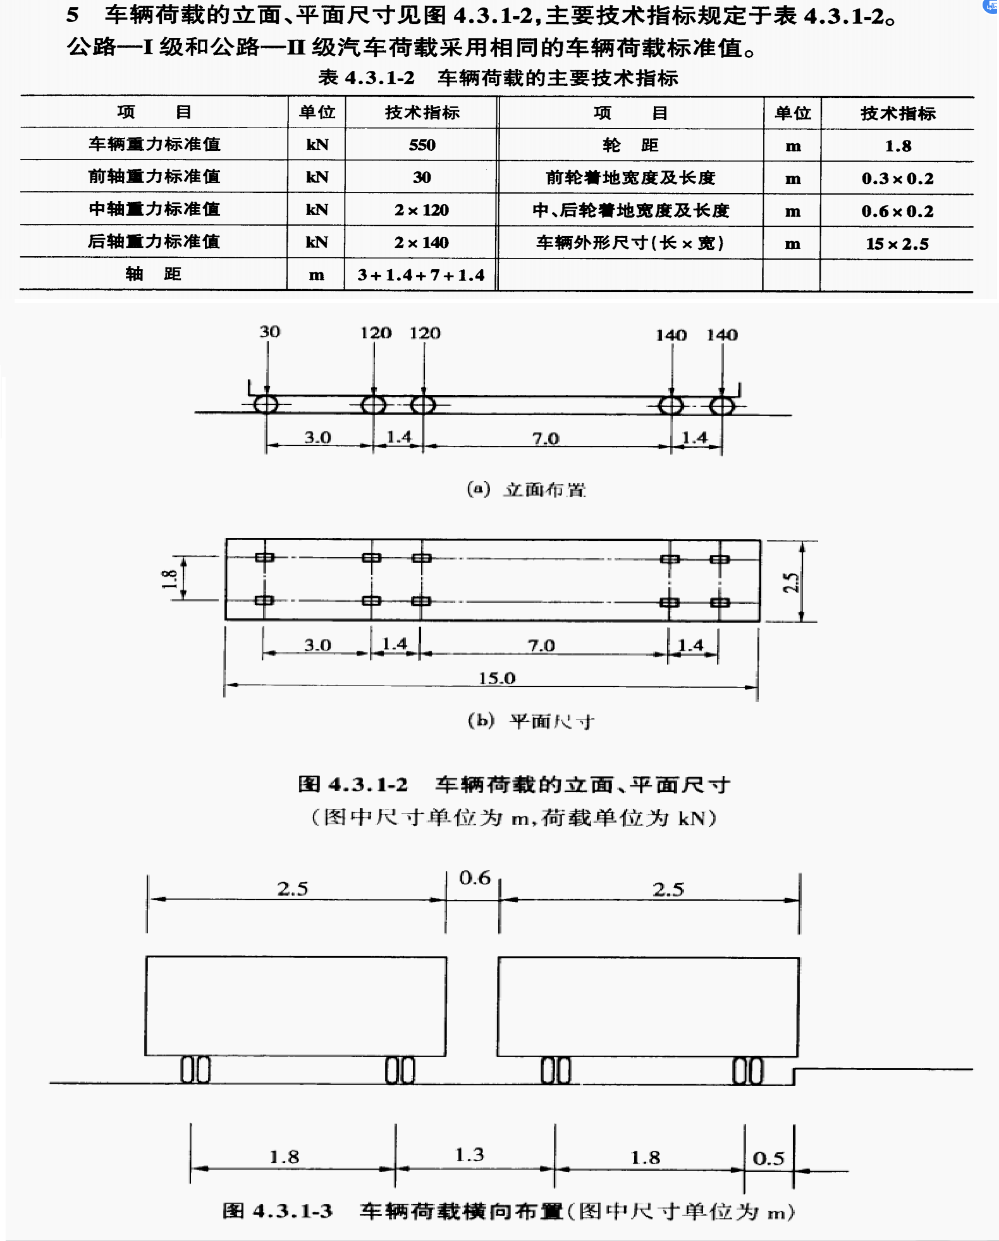
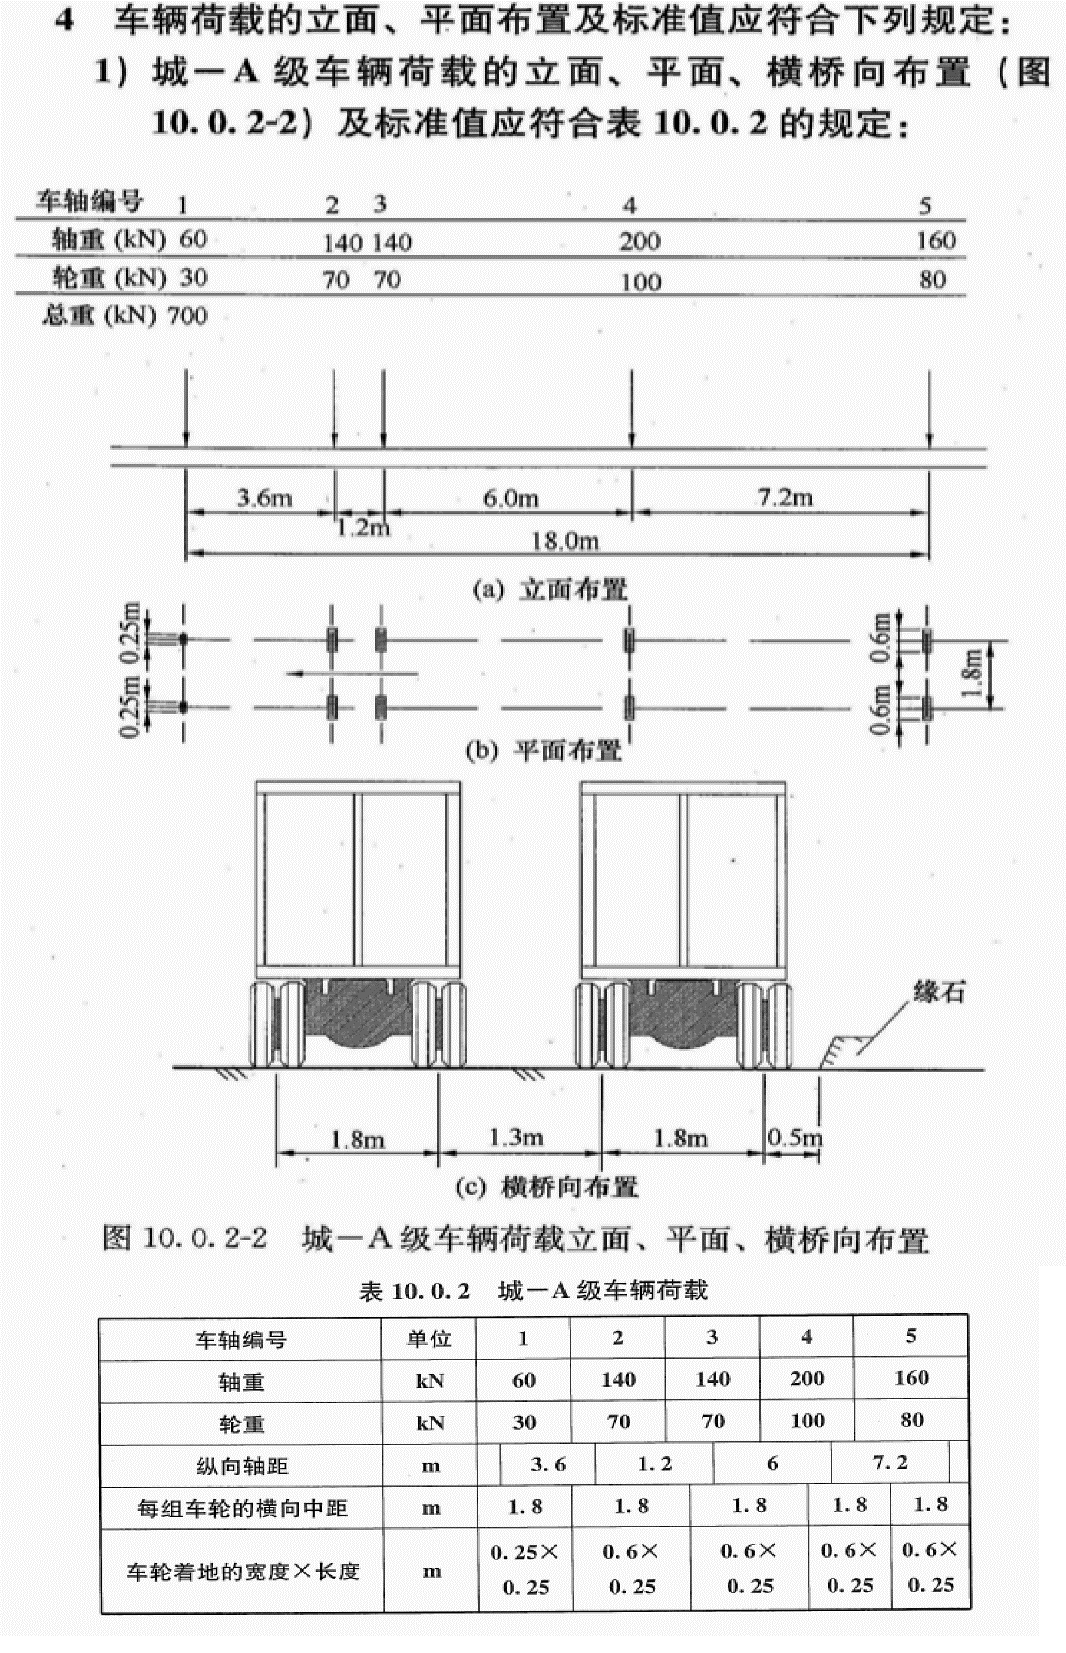
The software has built-in vehicle load parameters for two specifications: "General Specifications for Design of Highway Bridges and Culverts (JTG D60-2015)" and "Urban Bridge Design Specifications (2019 Edition) (CJJ 11-2011)". Diagrams are as follows:
-
Vehicle Loads
The software considers situations of single wheel action and two-wheel action overlapping, taking the larger effect.
For "General Specifications for Design of Highway Bridges and Culverts (JTG D60-2015)", maximum single wheel weight P1 takes 70kN, maximum double wheel weights P2, P3 take 70kN, 70kN, axle spacing takes 1.4m, wheel ground contact length perpendicular to plate span direction a1 takes 0.2m, wheel ground contact width parallel to plate span direction b1 takes 0.6m.
For "Urban Bridge Design Specifications (2019 Edition) (CJJ 11-2011)", maximum single wheel weight P1 takes 100kN, maximum double wheel weights P2, P3 take 70kN, 70kN, axle spacing takes 1.2m, wheel ground contact length perpendicular to plate span direction a1 takes 0.25m, wheel ground contact width parallel to plate span direction b1 takes 0.6m. Users can modify wheel weights P1, P2, P3, axle spacing D and a1, b1 values as needed. P2, P3 can be unequal.
-
Other Parameters
Bridge deck pavement thickness h has default value of 0.1m. Users need to confirm when using.
-
Structure Information
Users determine top plate range by selecting start node and end node of top plate range through point selection. The software automatically identifies top plate width, cantilever length, web thickness (horizontal projection) and box chamber width, all as horizontal projection lengths. Box chamber range corresponds to plate thickness being the minimum plate thickness within the range, web range corresponds to plate thickness being the smaller of the two box chamber corresponding plate thicknesses; cantilever range corresponds to plate thickness being two values: cantilever root thickness and cantilever end thickness.
The software automatically calculates plate width and corresponding top plate thickness and displays them, facilitating user verification. This value does not support modification.
-
Load Distribution Width
After vehicle longitudinal bridge layout and structure-related content are filled correctly, click "Calculate Distribution Width Values" button, the software will automatically calculate distribution width.
Results are given in two forms: horizontal distance and node number, facilitating user interaction with other software.
The software calculates single-wheel distribution width and double-wheel distribution width corresponding to each position of top plate according to provisions in Article 4.2.3, 4.2.5, and 4.2.5 of "Code for Design of Highway Reinforced Concrete and Prestressed Concrete Bridges and Culverts (JTG 3362-2018)", outputs in result table, and performs schematic drawing.
- Load values:
- According to different load positions, specifications require different. When wheel distribution overlap does not need to be considered, the load value in result table is ;
- When wheel distribution overlap needs to be considered, load values are calculated separately according to single-wheel distribution width a and double-wheel distribution width a, that is and are compared, taking the larger value.
- When wheel is located at support or near support: wheel distribution overlap does not need to be considered;
- When wheel is located at mid-span position: wheel distribution overlap needs to be considered;
- When wheel is located at cantilever position: when , reference AASHTO specification formula for cantilever plate load distribution width calculation, considering wheel distribution overlap; when , specification recommends adopting appendix formula, which directly calculates moment value, so the load distribution width displayed by software is back-calculated from moment value, not involving whether to consider wheel distribution width overlap.
- Load proportion coefficient = . This value is used to fill in "Transverse Moving Loads > Lane Lines" in structural calculation definition, load proportion coefficient table. Meanwhile in "Transverse Moving Loads > Vehicle Definition", wheel load needs to input the maximum single wheel weight P1 here, so that transverse influence line loading can be performed correctly.
- Load values:
15.4.3 Result Output
- The software supports output:
- Most unfavorable extreme values of node displacements, beam element internal forces/stresses, truss element internal forces/stresses, cable element internal forces/stresses, shell element internal forces/stresses, support reactions, constraint equation forces, and elastic link forces for live loads;
- Supports output of self-concurrent results of beam, truss, and cable element internal forces (for example, when maximum axial force Fx occurs at element I end, other internal force components occurring simultaneously in that element);
- Self-concurrent results of support reactions;
- Specific output is related to the following settings:
- The program only calculates relevant results of nodes, elements, elastic links, and constraint equations selected in "Moving Load Analysis Settings - Calculation Options".
- Output result cases are related to "Moving Load Analysis Cases - Whether to Save Sub-case Results". If not checked, only outputs total results of that live load case (discrimination superposition of each sub-case), including three result items: maximum, minimum, and envelope; if checked, besides total results, also outputs maximum, minimum, and envelope three result items of each sub-case separately.
15.4.4 Live Load Calculation Notes
- Influence surface consists of one node longitudinal array, using beam element shape function refinement, all lanes on that influence surface cannot exceed the minimum value of section widths of beam elements on that node longitudinal array;
- Influence surface consists of multiple node longitudinal arrays, using shell element shape function refinement (structure may not have shell elements), when refining influence surface, finds the four points closest to the calculation point on the node longitudinal array, performs linear interpolation to obtain results at calculation point position, so to ensure calculation result accuracy, need to define all longitudinal points on influence surface as node longitudinal arrays to form influence surface;

- Only the same influence surface will calculate transverse lane reduction coefficient;
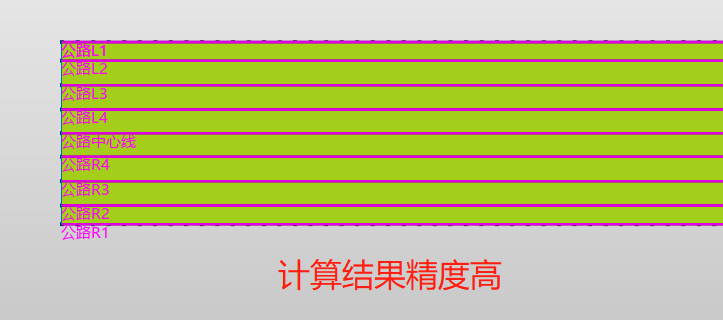
- For the same influence surface, centerline spacing between different highway lanes must be greater than or equal to 3.1m, if less than that, it will be ignored.
- In highway specifications, when calculating shear force effects, concentrated load is multiplied by 1.2 coefficient, support reactions and displacements do not consider 1.2 coefficient, element internal forces consider 1.2 coefficient.
15.5 Elastic Buckling (Stability) Analysis
The steps for Qiaotong software to perform elastic buckling (stability) analysis are as follows:
-
- Establish model. Note: When performing buckling analysis, construction stages do not need to be established, at this time analysis type defaults to "Linear".
-
- Establish additional load cases that need to be considered in stability calculation. Note: In additional cases, node concentrated loads, element concentrated loads and element distributed loads are effective, other load types are invalid.
-
- Perform elastic buckling analysis settings in "Analysis > Buckling Analysis", see Section 10.6.
-
- Click calculate, after success can view graphic and table results in "Results > Free Vibration and Buckling Analysis". See Section 11.3.
Note that the total effective load count (including self-weight and other cases) for variable loads must be greater than 0, otherwise calculation will error; if structure has no compression members, theoretically buckling will not occur, therefore buckling calculation results will not be output.
15.6 Linear/Nonlinear Analysis
In Qiaotong software, when performing construction stage analysis and operation additional load analysis, both linear or geometric nonlinearity can be considered, moving load analysis can only consider linearity.
-
Specific steps are as follows:
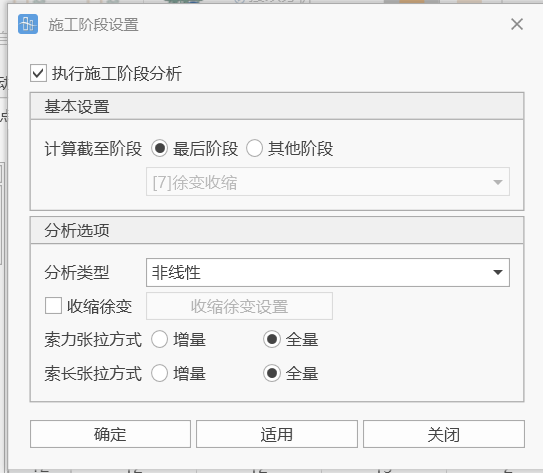
- Define analysis type as linear/nonlinear in "Analysis > Construction Stages > Analysis Options".
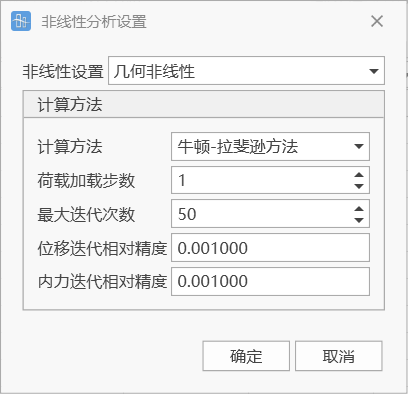
- Set nonlinear analysis related calculation parameters in "Analysis > Nonlinearity".
-
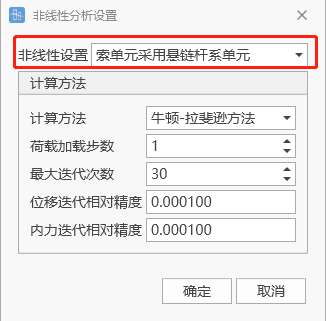
Nonlinear Settings
Geometric nonlinearity: Full model adopts complete geometric nonlinear algorithm for analysis.
Only cable elements use catenary link element analysis: Except cable elements using catenary link element analysis, other elements use linear analysis.
-
Calculation Method
Select nonlinear analysis solution method, including Newton-Raphson method, modified Newton-Raphson method.
-
Load Loading Steps
Gradually load loads according to number of steps.
-
Maximum Iteration Count
To make calculation converge, maximum repeated calculation times allowed within each loading step.
-
Displacement Iteration Relative Precision
Input convergence control precision for displacement criterion.
-
Internal Force Iteration Relative Precision
Input convergence control precision for internal force criterion.
🧐Notes:
Setting principles for various analysis types
Only two places can set whether to consider nonlinearity: construction stages and live loads
Operation stage analysis type except live loads is consistent with construction stages, cannot be set separately;
Live load analysis is set separately, its setting level is lower than construction stages
That is: when construction stage is linear analysis, live loads can only select linear analysis;
When construction stage is nonlinear analysis, live loads can select linear or nonlinear;
Construction Stage (Linear) Operation Stage (Linear) Moving Loads (Linear) Construction Stage (Nonlinear) Operation Stage (Nonlinear) Moving Loads (Linear or Nonlinear) Ø Live load analysis: (1) Linear calculation: adopts influence surface interpolation to calculate structural response; (2) Nonlinear calculation: determines most unfavorable loading position through influence surface, uses nonlinear calculation for live load effects.
Nonlinear analysis settings, if "Cable elements use catenary link elements" is selected, cable elements will use catenary line element stiffness matrix, other elements use linear stiffness matrix (when other elements calculate total stiffness, geometric deformation is not considered, but still participate in nonlinear iteration).
Boundary nonlinearity: If structure has one-way elastic links (tension only or compression only), one-way elastic supports (tension only or compression only), Qiaotong automatically adopts boundary nonlinear calculation.
15.7 Continued Analysis
-
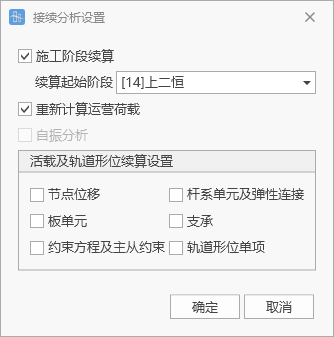
Function: After model calculation is successful and results are obtained, if certain construction stage parameters are modified, continued analysis function can be used to recalculate starting from that construction stage, avoiding repeated calculation of unmodified construction stages. Can also perform continued analysis for operation stage.
-
Command:
Select "Analysis" > "Continued Analysis" from the main menu;
-
Input
-
Construction Stage Continued Analysis
Select construction stage to start continued analysis.
-
Recalculate Operation Loads
Recalculate all operation loads.
-
Live Load and Track Shape Continued Analysis Settings
Recalculate live loads and track shape.
15.8 Construction Stage Result Warning Analysis
Qiaotong software's construction stage result warning analysis module can, for specified multiple construction stages and specified members (nodes, elements, supports, elastic links, etc.), with user setting reasonable stress ranges for members, once member internal forces, stresses, reactions, etc. exceed ranges, the program will immediately alarm. To help users improve monitoring efficiency and ensure construction safety. Specific process is as follows:
- Establish model, define construction stages, and complete construction stage calculation analysis. Or open a model with existing construction stage results.
- If the model itself already has warning settings, the program prompts user to select "Whether to perform construction stage warning analysis", selecting yes starts warning analysis. Otherwise, should open "Results > Construction Stage Warning > Warning Settings", set warning items, see 11.1.20, click OK to start warning analysis.
- After analysis completion, if there are over-limit items, the program will immediately alarm and prompt user to view warning results, if confirm to view, automatically opens warning result table; when result table is closed, can open again through "Results > Construction Stage Warning > Warning Results". See 11.1.21.
- Can view results in model graphic area through "Results > Construction Stage Warning > Warning Display". See 11.1.22.
- Can open "Results > Construction Stage Warning > Generate Verification Cases" as needed to perform detailed verification for reinforced concrete members and prestressed reinforced concrete members. See 11.1.23.